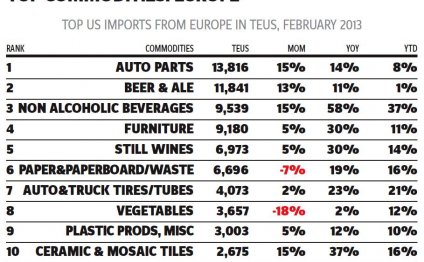
Top US imports
3. furniture
4. kitchen and household appliances
5. automobiles.
We had gone shopping for apparel for my son (a hat) and footwear for my wife (flip-flops). Had I the inclination and budget, we could have shopped for furniture (a floor lamp could really brighten up our apartment) and appliances (a blu ray player would be nice). All were available in one place. You can even buy a car right there on the south end of the Promenade, rounding out the #5 US import item.
Chances are if you are in the international shipping industry (or looking to be) then you are involved in the buying and selling of one or more of these specific commodities. The truth is that the bulk of consumer goods imported to the US fit into these 5 categories; apparel, footwear, furniture, appliances, and cars. These imports come from various places, but China dominates as the main source for several of them.
It is interesting to note that the average cost of the top imports increases the lower down the list you go. The most common import item – apparel - is the cheapest.
Apparel imports can be as cheap as a $3 headband to a $700 winter coat. Shoes also can cost the consumer relatively little or relatively much depending on brand, mark-ups, and material.
Furniture is (not surprisingly) relatively more expensive than the textiles in the number 1 and 2 slots. The cost of various appliances can have a wide range (from the coffee maker to the high-end washer and dryer) and where they come from. Of course, #5 – automobiles – are undoubtedly the most expensive in the list of the top 5 imports.
So here it is- the top 5 US imports and where they come from- hint: China is prominent, but you may find a surprise country.
China is the main source of US apparel imports, producing 36.49% of clothing shipped to the US for sale. The other top nations for clothing imported to the US trail significantly behind China percentage-wise. They are Vietnam (producing 9.4%), Indonesia (7.2%), and Bangladesh (6.7%).
China makes 84.95% of footwear imported to the US. Vietnam, Indonesia and Mexico trail far behind with 6.46%, 3.03%, and 0.88% respectively.
Again, China is in the lead, producing 58% of the furniture imported to the US. Vietnam (8%), Canada (7%), and Mexico (5%) hold the next 3 spots.
China produces 49% of the appliances imported to the US. Mexico is next with 25%, followed by South Korea and Canada (9% and 4% respectively).
RELATED VIDEO


Share this Post
Related posts
Top US imports and exports
New figures show that the U.S. trade deficit in March was the nation’s largest in six years. But what, exactly, is the nation…
Read More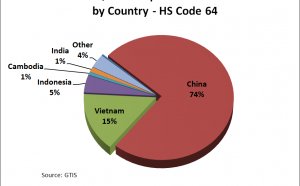
Total us imports
Although overall U.S. crude oil imports have been declining since 2005, crude oil imports from Canada have been increasing…
Read Morelatest post
-
 Economy of South Africa 2014 July 26, 2026
 -
 East Africa economic growth July 16, 2026
 -
 Business Coaching South Africa July 6, 2026
 -
 Economic system of Africa June 26, 2026
 -
 North Safety products Africa June 16, 2026
 -
 Countries Near South Africa June 6, 2026
 -
 Political economy of African May 27, 2026
 -
 Diamond industry in South Africa May 17, 2026
 -
 Africa products May 7, 2026